
Most dental practice owners have a fairly good understanding of what their practice earns each month, but revenue alone does not tell you whether the business is actually performing as well as it should. A practice can be busy, the books can look full and revenue can continue to grow, yet profitability can still be under pressure if expenses are increasing at the same time.
This is where financial benchmarking becomes useful, although I think benchmarks are sometimes misunderstood. They are not there to tell you whether your practice is good or bad, and they should not be viewed as a scoreboard against other practices. Their real value is in giving you a point of reference so that you can identify areas of the business that may deserve a closer look.
A benchmark simply shows what comparable dental practices tend to spend in particular areas, usually expressed as a percentage of gross patient fees. If one of your expense categories is sitting outside the typical range, it does not necessarily mean there is a problem, but it does give you a reason to ask why.
Why percentages give you a clearer picture
When comparing financial performance, percentages are usually far more useful than looking at dollar figures alone, because every dental practice operates at a different size and revenue level.
A practice generating $600,000 a year will obviously have very different expenses to one generating $2 million, but if both are spending 38% of gross patient fees on clinical provider costs, they are experiencing a similar cost pressure in that area. Looking at expenses as a percentage of revenue allows you to compare practices more meaningfully and, just as importantly, helps you recognise when your own costs are gradually increasing over time.
Before making any comparison, however, it is important to make sure you are comparing the same thing. If your own reports calculate expenses as a percentage of gross patient fees, you cannot directly compare them with a benchmark calculated from collections or net revenue, as the result can be misleading.
What should a dental practice be spending?
BDO Australia's dental practice benchmarking guidance provides some useful working ranges across the major expense categories, and while these should never be treated as rigid targets, they can help provide some context around your own figures.
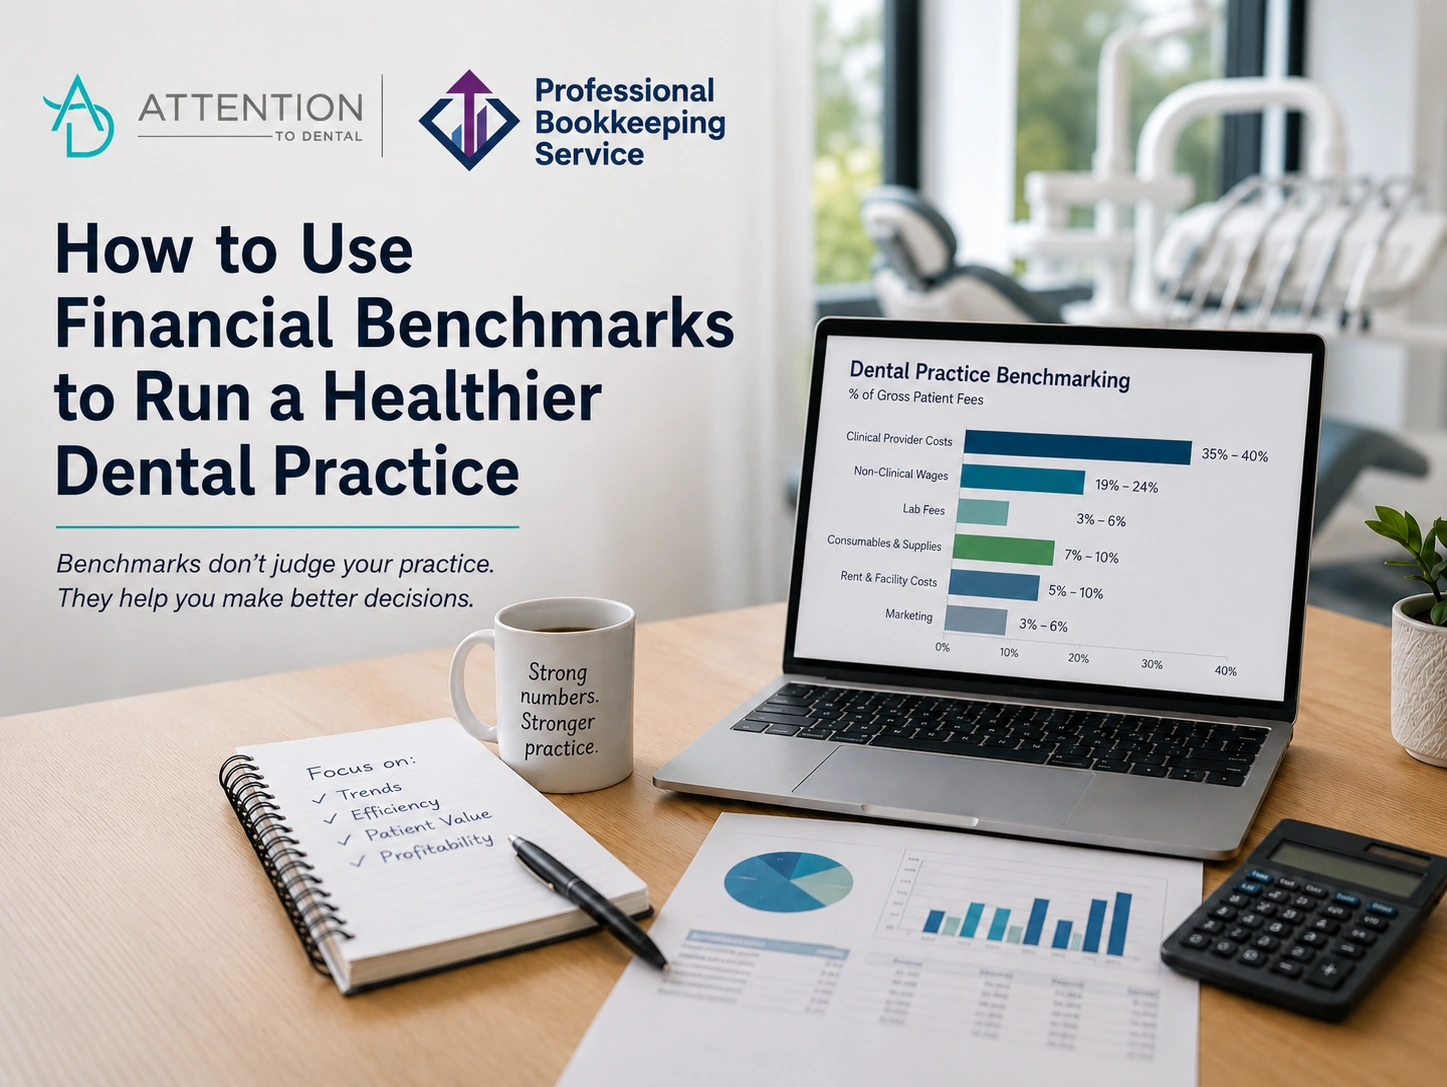
Clinical provider costs, which include dentists, hygienists and other clinical labour, commonly sit between 35% and 40% of gross patient fees. This is generally one of the largest expenses in a dental practice and has a significant impact on profitability. If your figure is above this range, I would not automatically assume there is a problem, but I would want to understand what is driving it. The answer might sit with provider productivity, staffing levels, treatment mix, remuneration structures or the way the principal dentist's clinical income has been recorded.
Non-clinical wages, including dental assistants, reception staff, practice managers and administration, typically sit between 19% and 24%. I think it is important to keep these costs separate from clinical wages because they tell you something quite different about the business. If support wages are increasing, you may need to look at rostering, administration structure, team utilisation or whether staffing levels still reflect the current workload of the practice.
Lab fees generally fall between 3% and 6%, although this is an area where treatment mix can make a significant difference. A practice completing a large amount of crown, implant or prosthodontic work will naturally have higher laboratory costs than a predominantly general practice, which is why the number itself should always be considered alongside what is actually being produced.
Consumables and dental supplies commonly sit between 7% and 10%, and this is one area where good financial reporting can be particularly valuable. If the percentage begins to creep upwards, it may be worth looking at ordering processes, stock levels, wastage, supplier pricing and whether purchasing decisions are being managed consistently across the practice. These can seem like relatively small expenses individually, but over the course of a year they can have a considerable impact on the bottom line.
Rent and facility costs will often sit somewhere between 5% and 10%, although once again the figure needs context. A practice paying higher rent for a busy, well-located clinic with excellent chair utilisation may be in a much healthier position than a practice paying lower rent but carrying empty treatment rooms for large parts of the week. Rather than looking at rent in isolation, I would consider it alongside chair utilisation, production per chair day and how effectively the available space is being used.
Marketing expenditure is commonly around 3% to 6%, but I believe this is one of the least useful figures to consider on its own. Spending more on marketing is not necessarily a problem if it is consistently bringing profitable patients into the practice. What matters is the return you are receiving, so marketing spend should always be considered alongside new patient numbers, cost of acquisition, treatment acceptance and the longer-term value of those patients to the practice.
Benchmarks need context
One of the biggest mistakes a practice owner can make is trying to force every financial category into an industry benchmark without understanding why their own figures look the way they do.
Every practice is different. Location, treatment mix, provider structure, team size, stage of growth and chair utilisation will all influence the numbers, which means there may be perfectly valid reasons why a practice sits above or below a typical range.
Newer or smaller practices can also look quite different because fixed costs tend to represent a larger percentage of revenue while patient numbers and chair utilisation are still developing. A figure that may be concerning in an established practice could therefore be completely reasonable in a practice that is still growing.
The more useful question is not simply, “Am I within the benchmark?” but rather, “What is driving this number, and is it moving in the right direction?”
That distinction is important because benchmarking should help you make better decisions, not create unnecessary concern about a percentage that may have a perfectly reasonable explanation.
The principal dentist's income can distort the picture
Another area that deserves careful attention is the remuneration of the principal dentist, particularly when the owner is still completing a significant amount of clinical work.
There is a difference between being paid for the dentistry you personally produce and receiving a return from owning the business, although these two amounts are often combined when owners look at practice profitability. If they are not separated correctly, the practice can appear more profitable than it really is.
To understand the true performance of the business, the principal dentist's clinical contribution should be treated in the same way you would account for another clinician performing that work. Once that amount has been allowed for, you are in a much better position to see what profit the business itself is actually generating.
Use benchmarks throughout the year, not once a year
For me, the biggest benefit of benchmarking comes when it becomes part of regular monthly reporting rather than something that is reviewed once a year with the accountant.
By the time you discover at the end of the financial year that wages, consumables or another expense category have increased significantly, you may have already carried that additional cost for many months. When the same information is reviewed regularly, you have the opportunity to respond much earlier.
A useful monthly dashboard does not need to be overly complicated, but it should give you visibility over gross patient fees and collections, clinical provider costs, non-clinical wages, lab fees, consumables, rent and facility costs, marketing expenditure and adjusted operating profit. I would also recommend looking at these figures as percentages wherever possible so that changes are easier to recognise from month to month.
Financial benchmarks will never tell you everything you need to know about your practice, and they should never replace an understanding of what is actually happening within the business. What they can do is provide another layer of information that helps you identify where to look, which questions to ask and where a small adjustment today may prevent a much larger problem later.
That is really the purpose of benchmarking. It is not about comparing yourself with the practice down the road; it is about understanding your own business well enough to make better decisions about where it goes next.
If you would like to discover more about building your budget Book a free, no-obligation call with Chris Stenhouse, Managing Director of Professional Bookkeeping Service.
The benchmark ranges referenced in this article are drawn primarily from BDO Australia's dental practice benchmarking guidance, with Practice Ownership Australia providing additional industry context. Benchmark figures should always be considered alongside the individual practice's size, location, treatment mix, provider structure, chair utilisation and stage of growth.
This article is general information to help you understand your numbers — it isn't personalised financial advice. Every practice's situation is different, so if you'd like help applying this to your own books, Professional Bookkeeping Service is here to walk through it with you.
Share The Article: